Bonus: the GLM family
PLS 206 — seven kinds of response, one recipe
The code behind the bonus deck (slides, PDF). One dataset, one predictor, seven kinds of response, and the GLM that fits each one. The interactive page lets you change the family and the coefficients and watch both scales.
- GLM_families.R: the plain script. Each block is tagged
[CORE],[HANDY], or[DEMO]in a comment. - GLM_families.qmd: this page as a Quarto notebook.
Every block of code on this page carries one of three labels:
- Core The analysis. Code you would run on your own data: fit the model, read the output, check the diagnostics, report it. Start here for the problem sets.
- Handy Useful, not essential. Wrangling, plotting, and small helpers that make the core easier. Worth knowing; skip on a first read.
- Demo For the lecture only. Simulated data, sums done by hand, and the code behind slide figures. It shows why the core works. Folded: click to open.
# install.packages(c("ggplot2", "MASS"))
library(ggplot2)
library(MASS)
Every GLM is three choices:
| 1. distribution | what kind of number \(y\) is, and how it scatters around its mean | Normal, Binomial, Poisson, negative binomial, Gamma |
| 2. linear predictor | the same straight-line formula as lm() |
\(\eta = \beta_0 + \beta_1 x_1 + \beta_2 x_2 + \dots\) |
| 3. link | connects the mean of \(y\) to the line | \(g(\mu) = \eta\), so \(\mu = g^{-1}(\eta)\) |
1) The data: seven responses, one predictor
120 wheat fields, each with one nitrogen rate (kg N/ha). Seven responses measured on every field (simulated):
| column | what it is | kind of number |
|---|---|---|
yield |
grain yield, t/ha | continuous |
lodged |
crop fell over: 1 = yes, 0 = no | 0/1 |
sown, emerged |
seeds sown in a row, seedlings that emerged | \(k\) of \(n\) |
beetles |
ground beetles in one pitfall trap, 7 days | count, same effort everywhere |
aphids |
aphids on 10 tillers | clumped count |
leaves, lesions |
leaves scored, septoria lesions on them | count, effort differs |
weed_biomass |
g/m² | positive, right-skewed |
survey <- read.csv("https://greymonroe.github.io/PLS_206/data/field_survey.csv")
head(survey)
field nitrogen yield lodged sown emerged beetles aphids leaves lesions
1 1 102 5.08 0 110 80 7 8 21 10
2 2 167 4.95 0 110 65 4 35 31 24
3 3 179 5.50 1 100 48 0 2 36 19
4 4 89 4.21 0 110 79 4 18 20 7
5 5 60 3.93 0 70 54 6 3 12 1
6 6 16 1.89 0 90 75 9 7 10 4
weed_biomass
1 2.3
2 29.4
3 149.0
4 49.5
5 50.4
6 13.4Demo: the seven responses against nitrogen
long <- rbind(
  data.frame(response = "yield (t/ha)",         nitrogen = survey$nitrogen, y = survey$yield),
  data.frame(response = "lodged (0/1)",         nitrogen = survey$nitrogen, y = survey$lodged),
  data.frame(response = "emerged / sown",       nitrogen = survey$nitrogen, y = survey$emerged / survey$sown),
  data.frame(response = "beetles per trap",     nitrogen = survey$nitrogen, y = survey$beetles),
  data.frame(response = "aphids per 10 tillers", nitrogen = survey$nitrogen, y = survey$aphids),
  data.frame(response = "lesions per leaf",     nitrogen = survey$nitrogen, y = survey$lesions / survey$leaves),
  data.frame(response = "weed biomass (g/m2)",  nitrogen = survey$nitrogen, y = survey$weed_biomass))
long$response <- factor(long$response, unique(long$response))
ggplot(long, aes(nitrogen, y)) +
  geom_point(colour = "#3D7BEB", alpha = 0.6) +
  facet_wrap(~ response, scales = "free_y", nrow = 2) +
  theme_classic()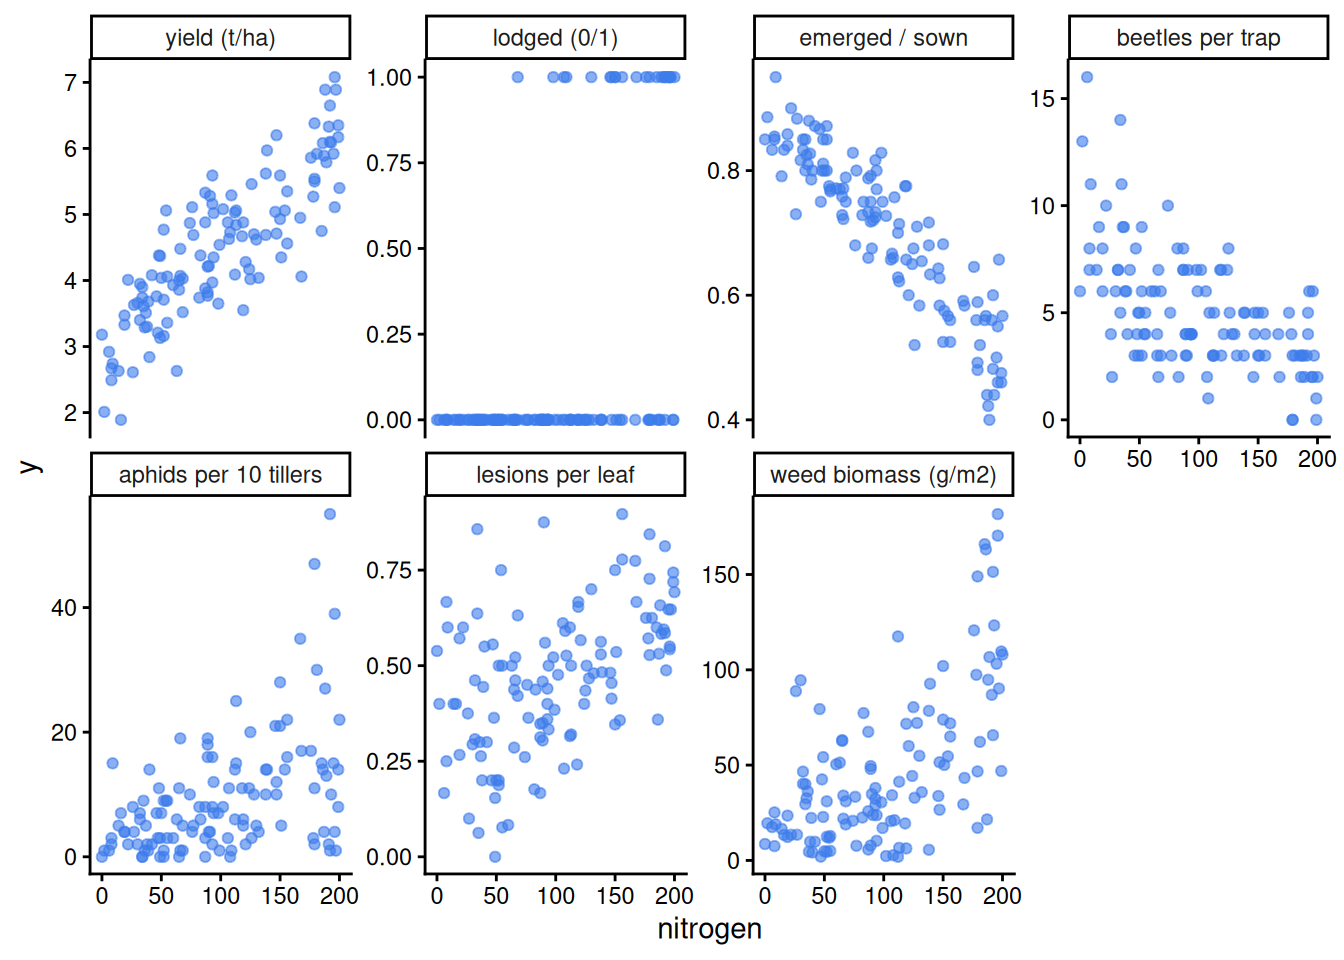
2) The link: keep the mean where it can live
A straight line runs from \(-\infty\) to \(+\infty\). The inverse link bends it into a range the mean can actually take. The link models the log (or logit) of the mean; it never transforms the data.
Demo: identity, log, and logit, drawn
eta <- seq(-4, 4, 0.05)
links <- rbind(data.frame(link = "identity: mu = eta",            eta, mu = eta),
               data.frame(link = "log: mu = exp(eta)",            eta, mu = exp(eta)),
               data.frame(link = "logit: mu = plogis(eta)",       eta, mu = plogis(eta)))
ggplot(links, aes(eta, mu)) +
  geom_line(colour = "#E0524A", linewidth = 1.2) +
  facet_wrap(~ link, scales = "free_y") +
  labs(x = "eta (the straight line)", y = "mu (the mean of y)") +
  theme_classic()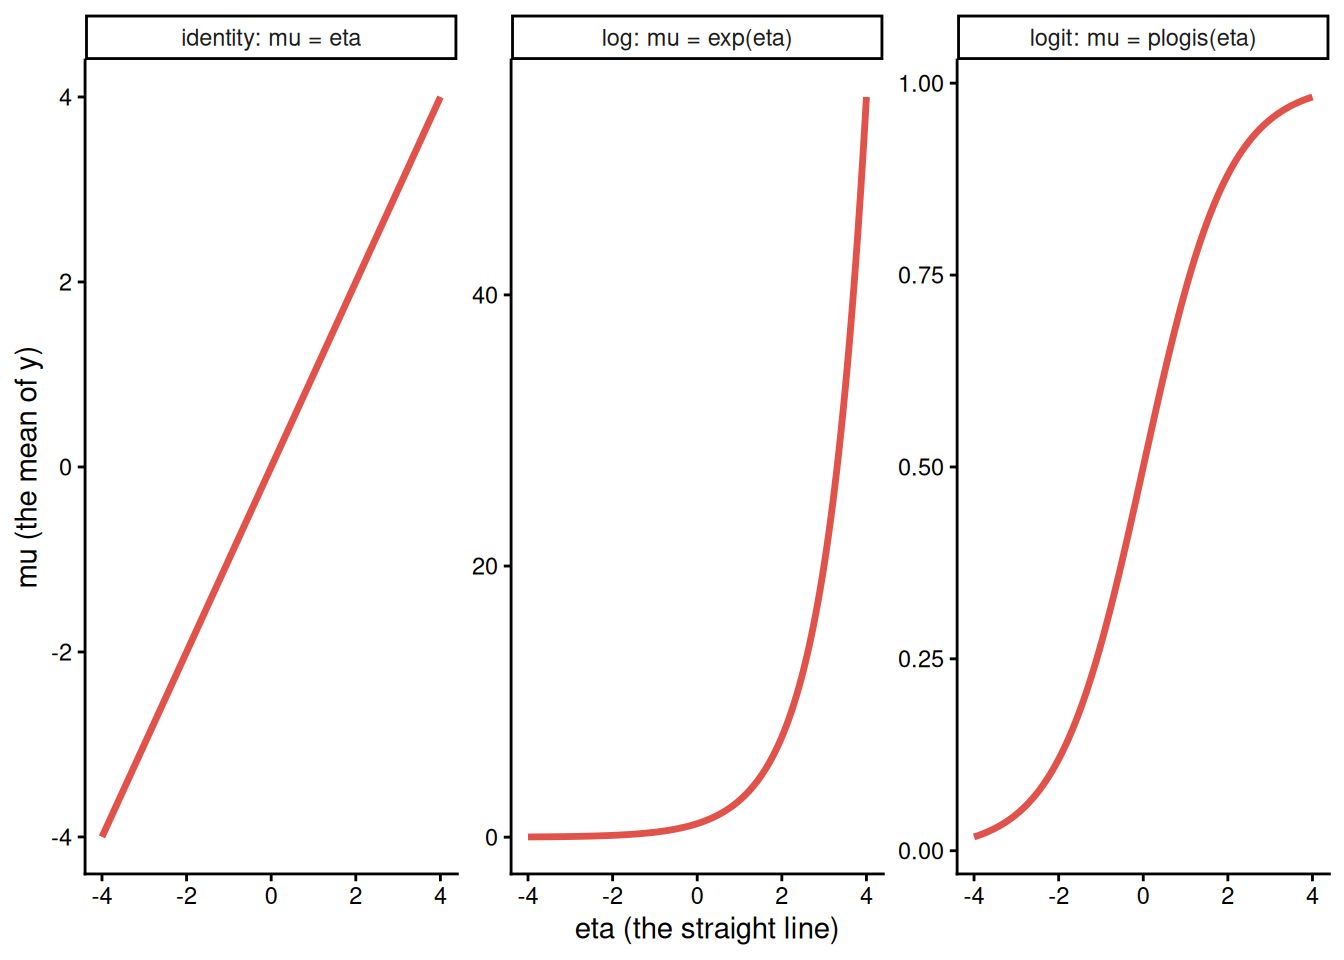
family(model)$linkfun and family(model)$linkinv hold the two directions for any fitted model; plogis() and exp() are the inverse links you will use most.
binomial()$linkfun(0.8) # logit: log(0.8 / 0.2)[1] 1.386294binomial()$linkinv(1.39) # back to a probability, same as plogis(1.39)[1] 0.8005922poisson()$linkinv(2) # exp(2)[1] 7.3890563) The family: how spread grows with the mean
The second choice. Each family says how the variance depends on the mean: Normal \(\sigma^2\) (constant), Poisson \(\mu\), negative binomial \(\mu + \mu^2/\theta\), Gamma \(\mu^2/k\) (constant CV), binomial \(p(1-p)/n\) for a proportion.
Demo: same rising mean, five families
set.seed(5)
x <- runif(400, 0, 10)
mv <- rbind(
  data.frame(family = "Normal",            x, y = rnorm(400, 2 + 1.6 * x, 2.5)),
  data.frame(family = "Poisson",           x, y = rpois(400, exp(0.5 + 0.28 * x))),
  data.frame(family = "negative binomial", x, y = rnbinom(400, mu = exp(0.5 + 0.28 * x), size = 2)),
  data.frame(family = "Gamma",             x, y = rgamma(400, shape = 3, rate = 3 / exp(0.5 + 0.28 * x))),
  data.frame(family = "binomial (k of 20)", x, y = rbinom(400, 20, plogis(-4 + 0.8 * x)) / 20))
mv$family <- factor(mv$family, unique(mv$family))
ggplot(mv, aes(x, y)) +
  geom_point(colour = "#3D7BEB", alpha = 0.4, size = 1) +
  facet_wrap(~ family, nrow = 1, scales = "free_y") +
  theme_classic()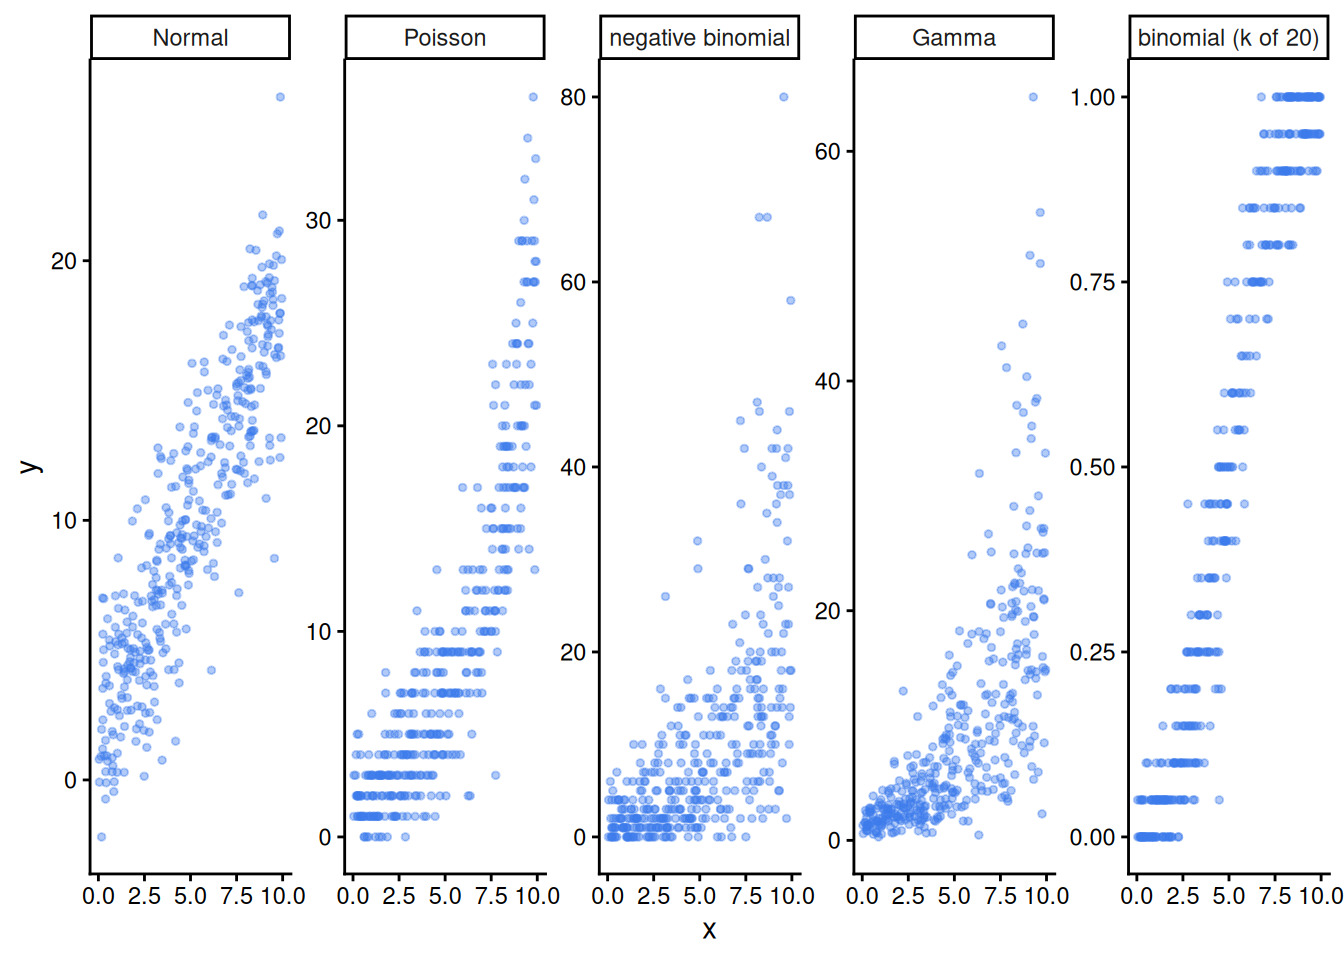
The seven models
Every section has the same shape: fit, read the coefficients, turn \(\beta_1\) into a statement in the response’s own terms. Nitrogen runs 0 to 200, so the effects are reported per 100 kg N.
4) Normal: yield
\(\text{yield} \sim \text{Normal}(\mu, \sigma^2)\), \(\mu = \beta_0 + \beta_1\,\text{N}\). lm() is this GLM: glm(family = gaussian) gives the same estimates.
m1 <- glm(yield ~ nitrogen, family = gaussian, data = survey)
coef(summary(m1))
Estimate Std. Error t value Pr(>|t|)
(Intercept) 2.9308407 0.1073437827 27.30331 7.922147e-53
nitrogen 0.0156731 0.0009275542 16.89723 2.716035e-33coef(lm(yield ~ nitrogen, data = survey)) # identical(Intercept) nitrogen
2.9308407 0.0156731 100 * coef(m1)["nitrogen"] # t/ha per 100 kg Nnitrogen
1.56731 5) Binomial, 0/1: did the crop lodge?
\(\text{lodged} \sim \text{Bernoulli}(p)\), \(\log\frac{p}{1-p} = \beta_0 + \beta_1\,\text{N}\). \(e^{\beta_1}\) is an odds ratio.
m2 <- glm(lodged ~ nitrogen, family = binomial, data = survey)
coef(summary(m2))
Estimate Std. Error z value Pr(>|z|)
(Intercept) -5.22043380 0.974492412 -5.357080 8.457768e-08
nitrogen 0.02981359 0.006350583 4.694622 2.670995e-06exp(coef(m2)["nitrogen"] * 100) # odds ratio, per 100 kg Nnitrogen
19.71459 exp(confint(m2)["nitrogen", ] * 100) # its 95% CI 2.5 % 97.5 %
6.373509 79.044255 predict(m2, data.frame(nitrogen = c(50, 150)), type = "response") # probabilities 1 2
0.02343629 0.32117102 6) Binomial, \(k\) of \(n\): seedlings emerged out of seeds sown
\(\text{emerged} \sim \text{Binomial}(\text{sown}, p)\), same logit link. Put cbind(successes, failures) on the left, so a row with 120 seeds weighs more than a row with 40.
m3 <- glm(cbind(emerged, sown - emerged) ~ nitrogen, family = binomial, data = survey)
coef(summary(m3))
Estimate Std. Error z value Pr(>|z|)
(Intercept) 1.876734509 0.0500493886 37.49765 1.005943e-307
nitrogen -0.009483404 0.0003892029 -24.36622 3.902679e-131exp(coef(m3)["nitrogen"] * 100) # odds ratio, per 100 kg N nitrogen
0.3873834 The same model, written as a proportion with weights:
m3b <- glm(emerged / sown ~ nitrogen, family = binomial, weights = sown, data = survey)
coef(m3b)
(Intercept) nitrogen
1.876734509 -0.009483404 7) Poisson: beetles per trap
\(\text{beetles} \sim \text{Poisson}(\mu)\), \(\log\mu = \beta_0 + \beta_1\,\text{N}\). \(e^{\beta_1}\) is a rate ratio. Every field had the same effort (one trap, one week).
m4 <- glm(beetles ~ nitrogen, family = poisson, data = survey)
coef(summary(m4))
Estimate Std. Error z value Pr(>|z|)
(Intercept) 2.125287480 0.0729219240 29.144698 9.751810e-187
nitrogen -0.005702565 0.0007423705 -7.681562 1.571607e-14exp(coef(m4)["nitrogen"] * 100) # rate ratio, per 100 kg N nitrogen
0.5653804 deviance(m4) / df.residual(m4) # about 1: Poisson spread fits[1] 0.97704818) Overdispersion: is Poisson enough for the aphids?
Poisson forces variance = mean. Residual deviance / df well above 1 means the counts are more spread out than that, and the Poisson standard errors are too small.
m5p <- glm(aphids ~ nitrogen, family = poisson, data = survey)
deviance(m5p) / df.residual(m5p)
[1] 5.934917Demo: the Poisson 95% band is far too narrow for the aphids
g <- data.frame(nitrogen = 0:200)
g$mu <- predict(m5p, g, type = "response")
g$lo <- qpois(0.025, g$mu); g$hi <- qpois(0.975, g$mu)
ggplot(survey, aes(nitrogen, aphids)) +
  geom_ribbon(data = g, aes(nitrogen, ymin = lo, ymax = hi), inherit.aes = FALSE, fill = "red", alpha = 0.15) +
  geom_point(colour = "#3D7BEB") +
  geom_line(data = g, aes(nitrogen, mu), colour = "red") +
  theme_classic()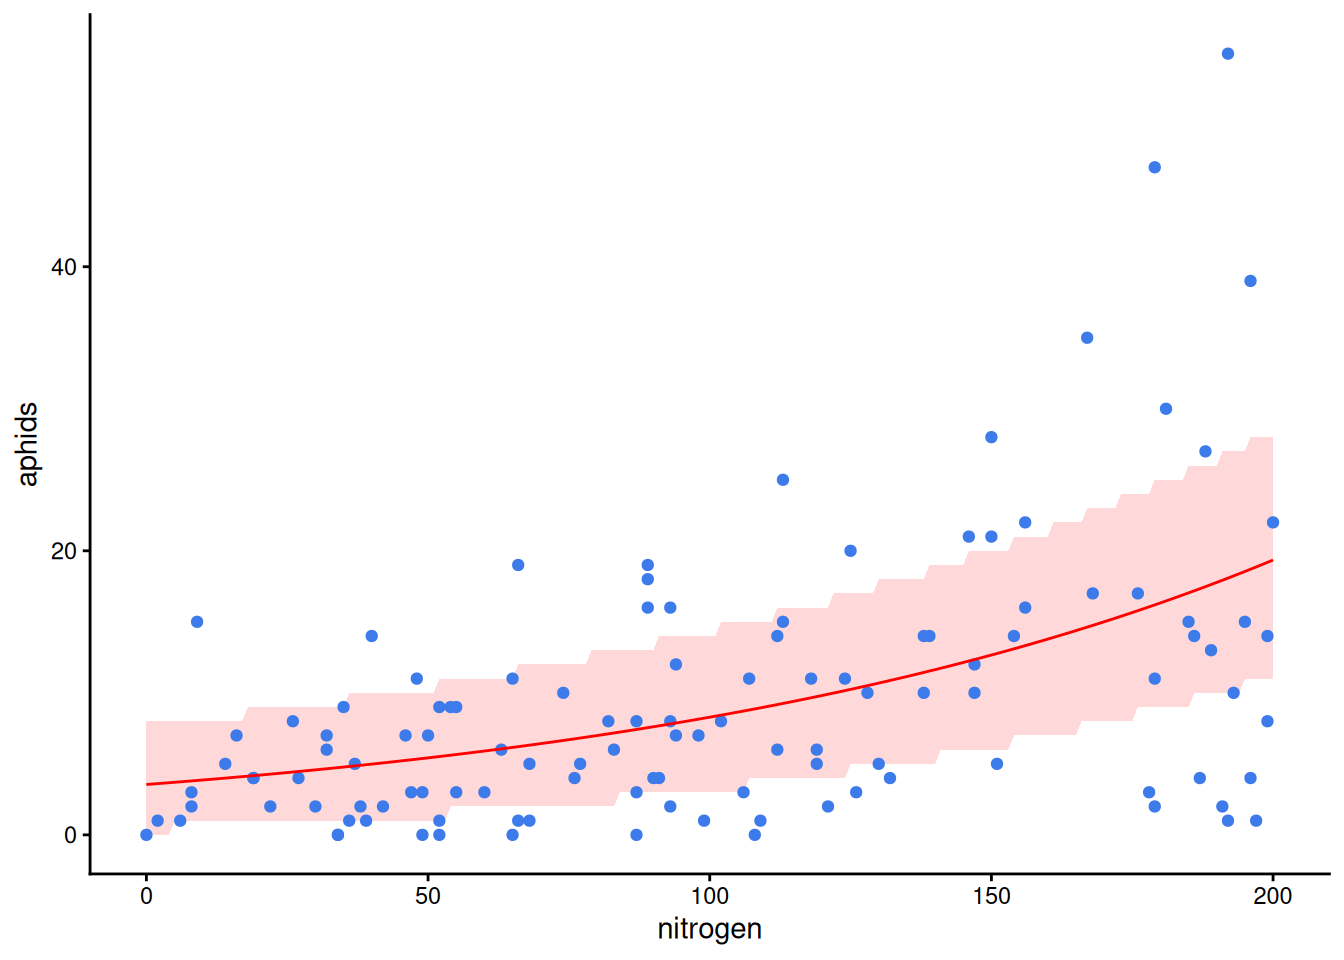
Demo: the Poisson 95% band is far too narrow for the aphids
outside <- with(survey, aphids < qpois(0.025, fitted(m5p)) | aphids > qpois(0.975, fitted(m5p)))
mean(outside)   # share of fields outside the band (should be about 0.05)
[1] 0.36666679) Negative binomial: aphids
\(\text{aphids} \sim \text{NegBin}(\mu, \theta)\), \(\log\mu = \beta_0 + \beta_1\,\text{N}\), \(\text{Var} = \mu + \mu^2/\theta\). Same link and same reading of \(\beta_1\) as Poisson; one more parameter for the spread.
m5 <- glm.nb(aphids ~ nitrogen, data = survey)
coef(summary(m5))
Estimate Std. Error z value Pr(>|z|)
(Intercept) 1.231085761 0.159436330 7.721488 1.149791e-14
nitrogen 0.008786187 0.001327348 6.619353 3.607748e-11m5$theta # smaller = more clumped[1] 1.702964exp(coef(m5)["nitrogen"] * 100) # rate ratio, per 100 kg Nnitrogen
2.407572 # the standard error of the nitrogen slope, three ways
m5q <- glm(aphids ~ nitrogen, family = quasipoisson, data = survey)
c(poisson = coef(summary(m5p))[2, 2],
quasipoisson = coef(summary(m5q))[2, 2],
negbin = coef(summary(m5))[2, 2]) poisson quasipoisson negbin
0.0005253985 0.0012679079 0.0013273483 10) Counts per effort: the offset
Scouts scored different numbers of leaves per field, and more on high-nitrogen fields. The question is lesions per leaf. An offset puts \(\log(\text{leaves})\) in the linear predictor with its coefficient fixed at 1:
\[\log\mu = \log(\text{leaves}) + \beta_0 + \beta_1\,\text{N} \quad\Longleftrightarrow\quad \log\frac{\mu}{\text{leaves}} = \beta_0 + \beta_1\,\text{N}\]
m6 <- glm(lesions ~ nitrogen + offset(log(leaves)), family = poisson, data = survey)
coef(summary(m6))
Estimate Std. Error z value Pr(>|z|)
(Intercept) -1.162398954 0.0726126759 -16.008210 1.119857e-57
nitrogen 0.003668435 0.0005034928 7.285972 3.193588e-13exp(coef(m6)["nitrogen"] * 100) # lesions per leaf, ratio per 100 kg Nnitrogen
1.443172 deviance(m6) / df.residual(m6)[1] 1.162381Leave the offset out and nitrogen also gets the credit for the extra leaves scored:
m6x <- glm(lesions ~ nitrogen, family = poisson, data = survey)
exp(coef(m6x)["nitrogen"] * 100)       # no offset: too steep
nitrogen
2.735118 cor(survey$nitrogen, survey$leaves) # because effort rises with nitrogen[1] 0.9251543Predictions from an offset model need the effort column. leaves = 1 gives the rate per leaf:
predict(m6, data.frame(nitrogen = c(50, 150), leaves = 1), type = "response") 1 2
0.3756952 0.5421927 The negative binomial takes an offset the same way: glm.nb(y ~ x + offset(log(effort))).
11) Gamma: weed biomass
Positive, continuous, right-skewed, spread growing with the mean. \(\text{weeds} \sim \text{Gamma}\), \(\log\mu = \beta_0 + \beta_1\,\text{N}\), \(\text{Var} = \mu^2/k\).
m7 <- glm(weed_biomass ~ nitrogen, family = Gamma(link = "log"), data = survey)
coef(summary(m7))
Estimate Std. Error t value Pr(>|t|)
(Intercept) 2.898090364 0.130031201 22.287654 4.156874e-44
nitrogen 0.008254916 0.001123595 7.346875 2.867309e-11exp(coef(m7)["nitrogen"] * 100) # ratio of mean biomass, per 100 kg Nnitrogen
2.283003 1 / summary(m7)$dispersion # the shape k (about 2 in the simulation)[1] 1.93408The usual alternative, lm(log(y) ~ x), models the mean of \(\log y\) (a geometric mean), not the mean itself, and fails on zeros:
exp(coef(lm(log(weed_biomass) ~ nitrogen, data = survey))["nitrogen"] * 100)nitrogen
2.530331 Reading and plotting any GLM
12) One rule per link
| link | model | \(x + 1\) does |
|---|---|---|
| identity | \(\mu = \beta_0 + \beta_1 x\) | adds \(\beta_1\) to the mean |
| log | \(\mu = e^{\beta_0} e^{\beta_1 x}\) | multiplies the mean by \(e^{\beta_1}\) |
| logit | \(\text{odds} = e^{\beta_0} e^{\beta_1 x}\) | multiplies the odds by \(e^{\beta_1}\) |
new <- data.frame(nitrogen = c(50, 150), leaves = 1)
predict(m2, new, type = "link")        # log-odds
1 2
-3.7297544 -0.7483955 predict(m2, new, type = "response") # probability 1 2
0.02343629 0.32117102 13) The fitted curve with a confidence band, for any family
Build the band on the link scale (where it is symmetric), then back-transform.
glm_curve <- function(model, data, x = "nitrogen", ...) {
  g <- data.frame(seq(min(data[[x]]), max(data[[x]]), length.out = 200), ...)
  names(g)[1] <- x
  p <- predict(model, g, type = "link", se.fit = TRUE)
  inv <- family(model)$linkinv
  g$fit <- inv(p$fit)
  g$lo <- inv(p$fit - 1.96 * p$se.fit)
  g$hi <- inv(p$fit + 1.96 * p$se.fit)
  g
}
band <- glm_curve(m4, survey)
ggplot(survey, aes(nitrogen, beetles)) +
  geom_ribbon(data = band, aes(nitrogen, ymin = lo, ymax = hi), inherit.aes = FALSE, alpha = 0.2) +
  geom_point(colour = "#3D7BEB") +
  geom_line(data = band, aes(nitrogen, fit), colour = "red", linewidth = 1) +
  theme_classic()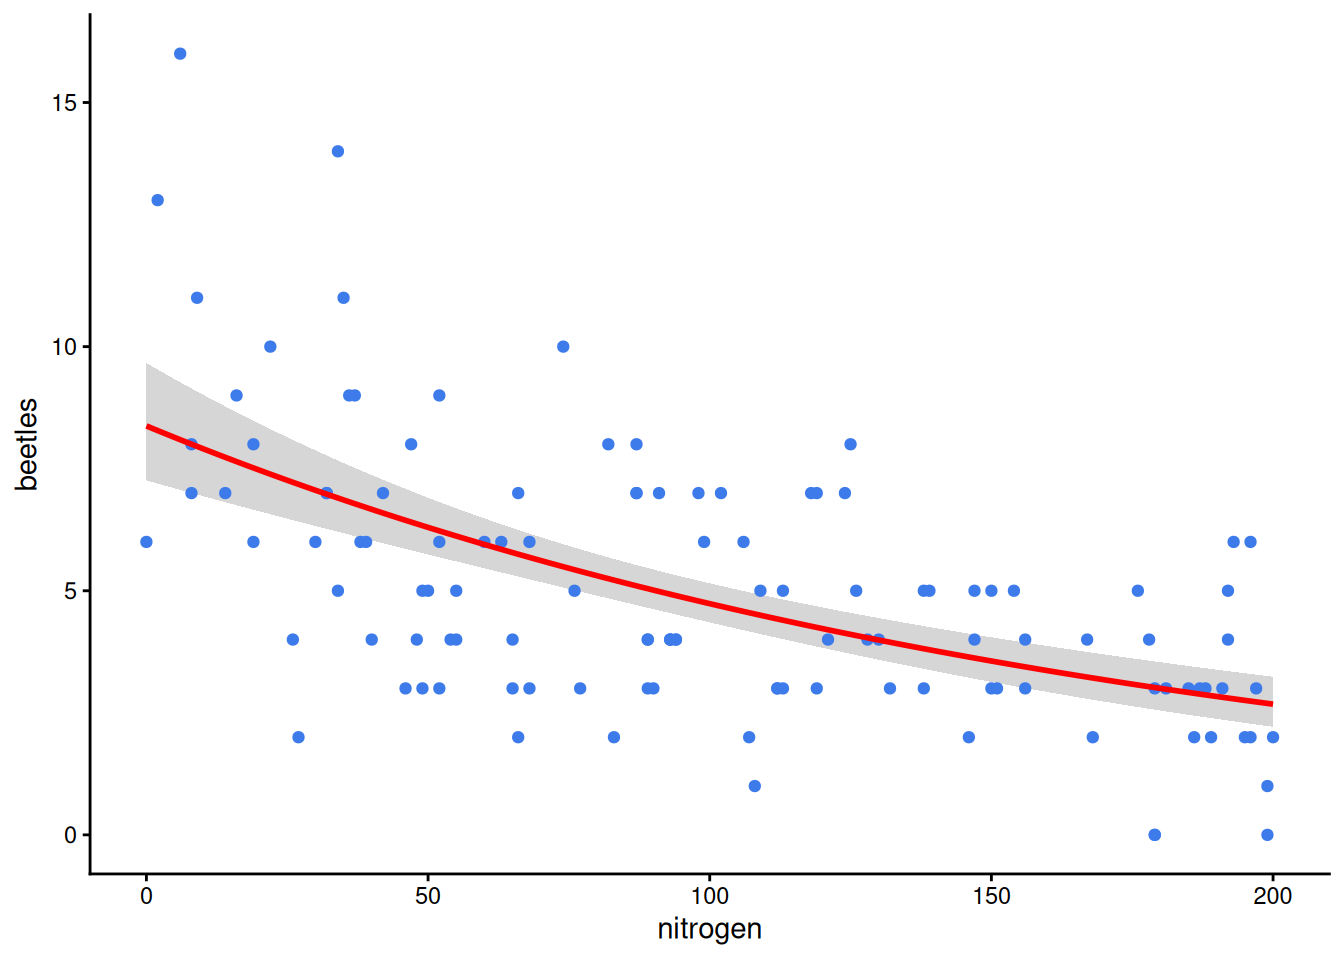
14) All seven at once
models <- list(yield = m1, lodged = m2, emerged = m3, beetles = m4,
               aphids = m5, lesions = m6, weeds = m7)
data.frame(
  family = sapply(models, function(m) family(m)$family),
  link   = sapply(models, function(m) family(m)$link),
  beta1  = sapply(models, function(m) coef(m)["nitrogen"]),
  per100 = sapply(models, function(m) {
    b <- 100 * coef(m)["nitrogen"]
    if (family(m)$link == "identity") b else exp(b)
  }),
  p = sapply(models, function(m) coef(summary(m))["nitrogen", 4]))
family link beta1 per100 p
yield gaussian identity 0.015673099 1.5673099 2.716035e-33
lodged binomial logit 0.029813589 19.7145882 2.670995e-06
emerged binomial logit -0.009483404 0.3873834 3.902679e-131
beetles poisson log -0.005702565 0.5653804 1.571607e-14
aphids Negative Binomial(1.703) log 0.008786187 2.4075717 3.607748e-11
lesions poisson log 0.003668435 1.4431720 3.193588e-13
weeds Gamma log 0.008254916 2.2830028 2.867309e-11per100 is a difference for yield (t/ha), an odds ratio for lodged and emerged, and a ratio of means for the rest.
15) Beyond these seven
| response | function |
|---|---|
| ordered categories (none < mild < severe) | MASS::polr() |
| three or more unordered categories | nnet::multinom() |
| too many zeros | glmmTMB::glmmTMB(..., ziformula = ~ 1) |
| continuous proportions (% cover) | glmmTMB::glmmTMB(..., family = beta_family()) |
| any of these with plots nested in farms | lme4::glmer(..., family = ...) |